
Introduction
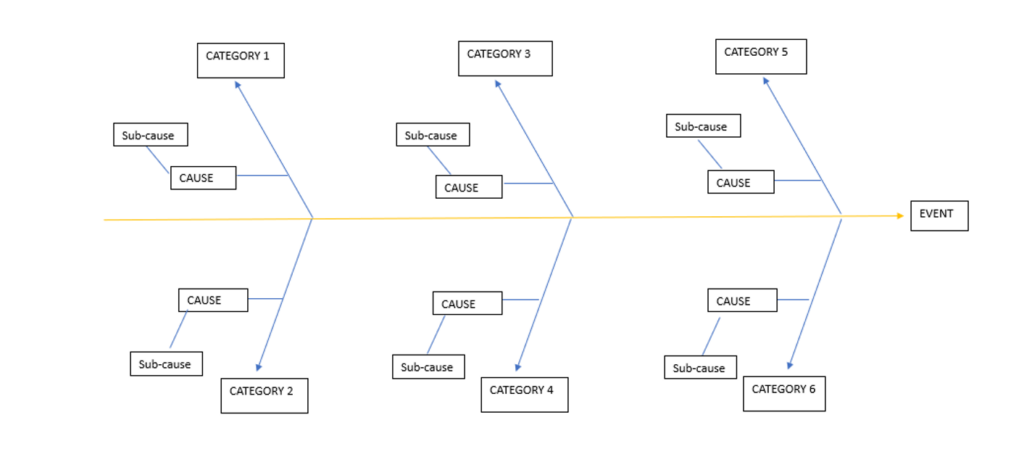
The Ishikawa Diagram, also known as the Fishbone diagram, is a tool used to visually explore and identify possible root causes of a specific event. The Diagram resembles a fish skeleton, with the head being the event in question and potential causes represented as the fishbones protruding from the spine.
Why use the Ishikawa Diagram?
The Ishikawa Diagram is an exceptional tool to use in risk management due to its efficacy in organizing and displaying the potential causes of an event, visually.
The Diagram structures brainstorming sessions by sorting ideas into categories, making the process of identifying risks and root causes more effective. This method is often used when performing root cause analysis, representing the cause-and-effect relationships between factors. It can also be used in conjunction with the “5-why method”. You can add as many causes and sub-causes as is needed. The end-goal is to identify as many potential causes as possible, helping you and your team understand and solve the issue at hand.
Step-by-step guide
- Pick out an event you wish to work at.
- Draw a box around your chosen event and draw an arrow running to it horizontally.
- Identify overall categories of causes leading to the chosen event. It´s possible to use general categories such as equipment, materials, environment, people etc.
- Chosen categories must be written branching of from the horizontal arrow.
- All possible causes must now be identified through brainstorming. As the team comes up with ideas, they must be written down, branching off from the appropriate categories. Each cause can be written in multiple categories if appropriate.
- To further the diagram, the team must continuously ask “why does this happen?” about each cause, to identify sub-causes branching off causes. For each time the team asks “why?” they will dig deeper and find more causes
Strength and weaknesses
Strengths
- Easy to use
- Easy to learn
- Visual representation of problem and root causes making it easier to understand and communicate
- Helps identify many causes for an event.
Weaknesses
- It can lead to incorrect conclusions based on lack of knowledge about the subject.
- Best suited for short phrases and ideas, as it has a tendency to get confusing and cluttered
- Can be time consuming
- Risk of focusing too much on individual factors rather than how the factors interact.
Sources
Fishbone diagram | The cause-effect diagram explained - IONOS CA


